az-firewall-watch is a terminal UI for live log monitoring of Azure Firewall. It streams firewall logs from an Event Hub in near real-time and lets you filter and inspect them directly in your terminal. Think tail -f for Azure Firewall, without waiting for Log Analytics ingestion. With read access to Azure Resource Manager it also shows the firewall’s policy and IP groups, and explains which rule a log row matched. Built in Python with Textual, released under the MIT license.
Download latest release → · Documentation → · GitHub →
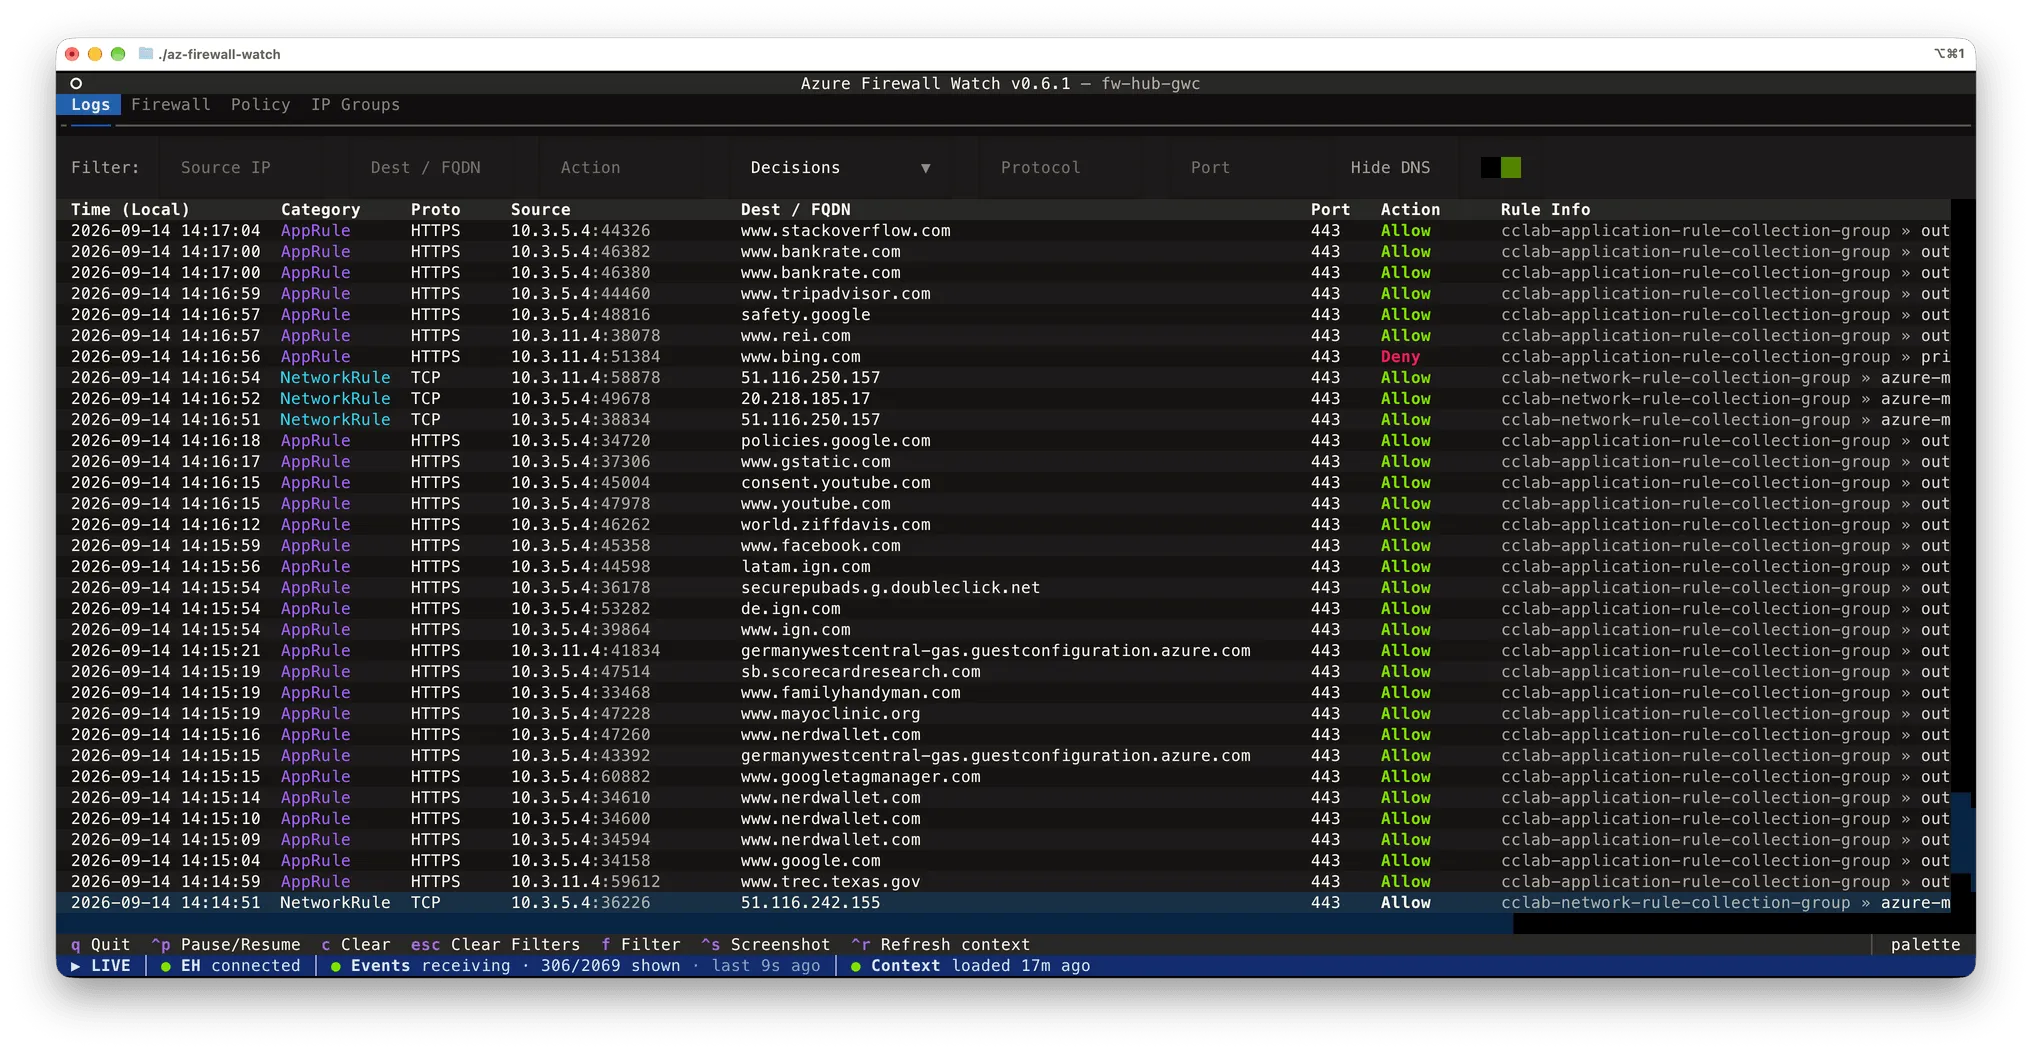
The idea is based on the excellent azure-firewall-mon by Nicola Delfino, a web app (Angular SPA plus an Azure Functions backend) that you deploy into your own environment. az-firewall-watch takes that idea to the terminal and extends it: it is a single local binary with nothing to deploy besides the Event Hub, it brings a setup wizard that can provision the whole log pipeline for you, supports passwordless Entra ID authentication, and adds policy context on top of the raw logs.
What it does
- Live log stream from an Event Hub: structured and legacy log formats, every category from
NetworkRuletoFatFlow, with automatic reconnect. - Instant filters on source, destination, action, category, protocol and port, CIDR prefixes included, plus one-click presets that separate decisions from observations and DNS noise.
- Dual-stack firewalls: IPv6 addresses show up in the table, the detail dialog, the filters and the evaluation trace.
- Policy context: Firewall, Policy and IP Groups tabs built from Azure Resource Manager, with log rows enriched by what the policy says.
- Evaluation trace: press
Enteron a row to see the path that flow took through the policy, collection by collection, up to the rule that matched. - Setup wizard that finds or deploys the Event Hub, wires up Diagnostic Settings and writes your configuration.
- Single binary for Windows, macOS and Linux, no Python install required.
Why the evaluation trace matters
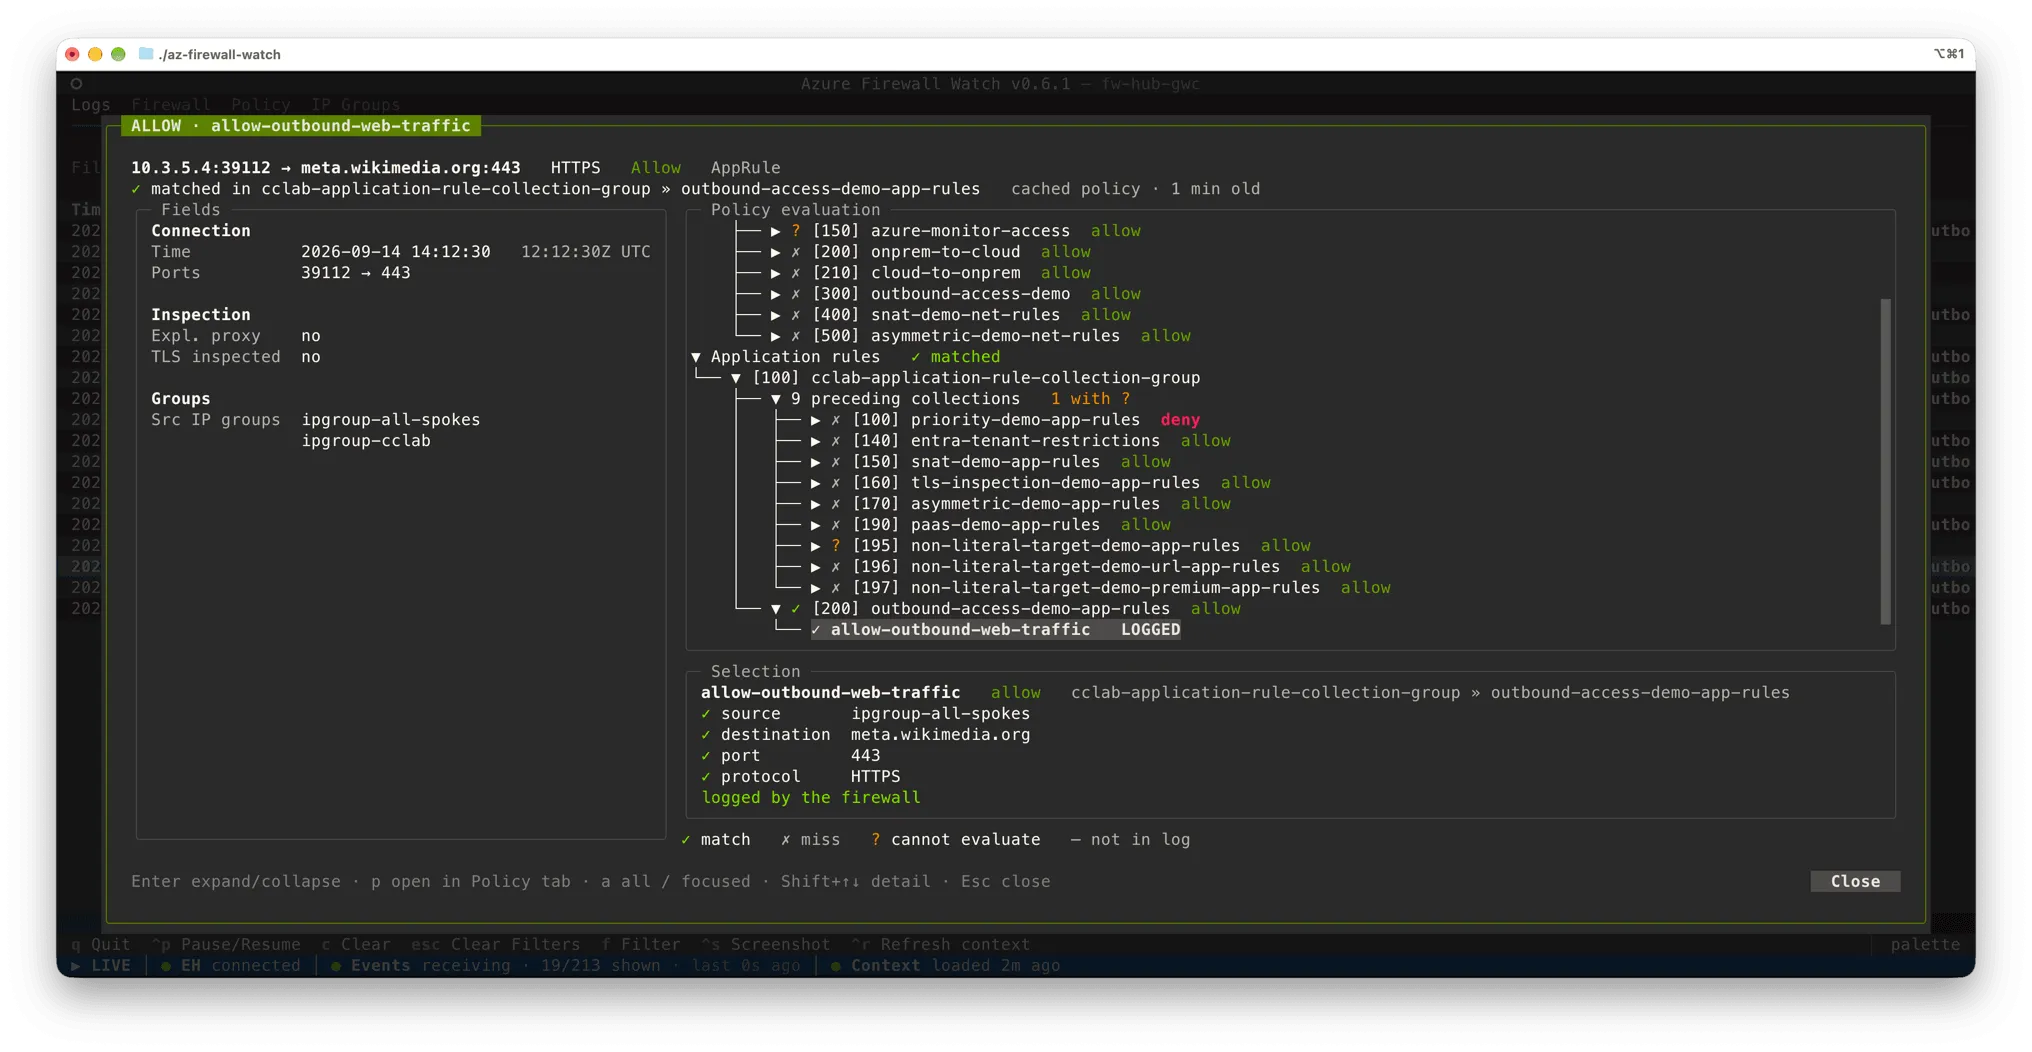
The trace is computed against your real policy, so it also works in the other direction: on a Deny, no rule matched row it walks the whole path and names the criterion that kept each near miss out, down to port: 8443 not in 443. That is usually faster than reading the policy yourself.
How it works
The viewer reads from two independent sources, and only the first one is required. Diagnostic Settings on your Azure Firewall forward the log categories to an Event Hub, which buffers the events so the viewer can consume them live. Azure Resource Manager is read on demand for the firewall, its policy and the referenced IP groups. That is what powers the extra tabs and the evaluation trace. It is strictly read-only and can be switched off entirely.
Azure Firewall
    └─▶ Diagnostic Settings
            └─▶ Event Hub  ◀─── az-firewall-watch (live logs, required)

Azure Resource Manager  ····▶ az-firewall-watch (policy context, optional, read-only)
The Event Hub is typically cheap. A Basic-tier namespace costs roughly $10/month plus a few cents per million events (check the Event Hubs pricing page for current numbers).
Getting started
Download the binary for your platform from the latest release and run it. The setup wizard starts automatically on first launch: pick an existing Event Hub, or let it deploy a new one including the diagnostic settings. Authentication is either Entra ID (passwordless, recommended) or a Listen-only SAS rule. You can also run it from source with Python 3.10 or newer.
The documentation lives in the repository: Getting started, Using the viewer, Policy context, Configuration, Log categories and Event Hub. Issues and feature requests are welcome, and a ⭐ is appreciated, too.