
A connection through Azure Firewall fails, and we are troubleshooting it live on a call. The customer’s network security team shares their screen: their on-prem Palo Altos or FortiGates show the rule hits as they happen. I adjust a rule on our side, they retry, and I open Log Analytics. Nothing yet. A few minutes later I run the KQL query again (which, to be honest, is not my strongest discipline either 😶🌫️). Still nothing. Everyone on the call stays very polite about it. 🥲
That gap is why I built az-firewall-watch. It is a terminal UI that streams Azure Firewall logs in near real-time from an Event Hub, filters them as you type and, since version 0.5, tells you which rule decided a flow and why the rules before it did not match. Think tail -f for Azure Firewall, plus someone who has actually read your policy. Now our Azure Firewall can keep up, too. 😉
It is open source (MIT), and prebuilt binaries for Windows, macOS and Linux are in the latest release. When I first shared it on LinkedIn in May 2026, it was a very early version: a live table with filters. Judging by the response (almost 500 of you clicked through to the repo), I am clearly not the only one waiting for Log Analytics. Since then it has learned to read the policy, and that changed what I use it for. The tool page always shows the current state. This post is the story behind it.
Credit where it’s due: the original idea comes from the excellent azure-firewall-mon by Nicola Delfino, a web app (Angular plus an Azure Functions backend) that you deploy into your own environment. I wanted the same experience in my terminal, with nothing to deploy besides the Event Hub. And then I kept going.
Logs while they are still warm
Here is the Logs tab during a session in my lab:
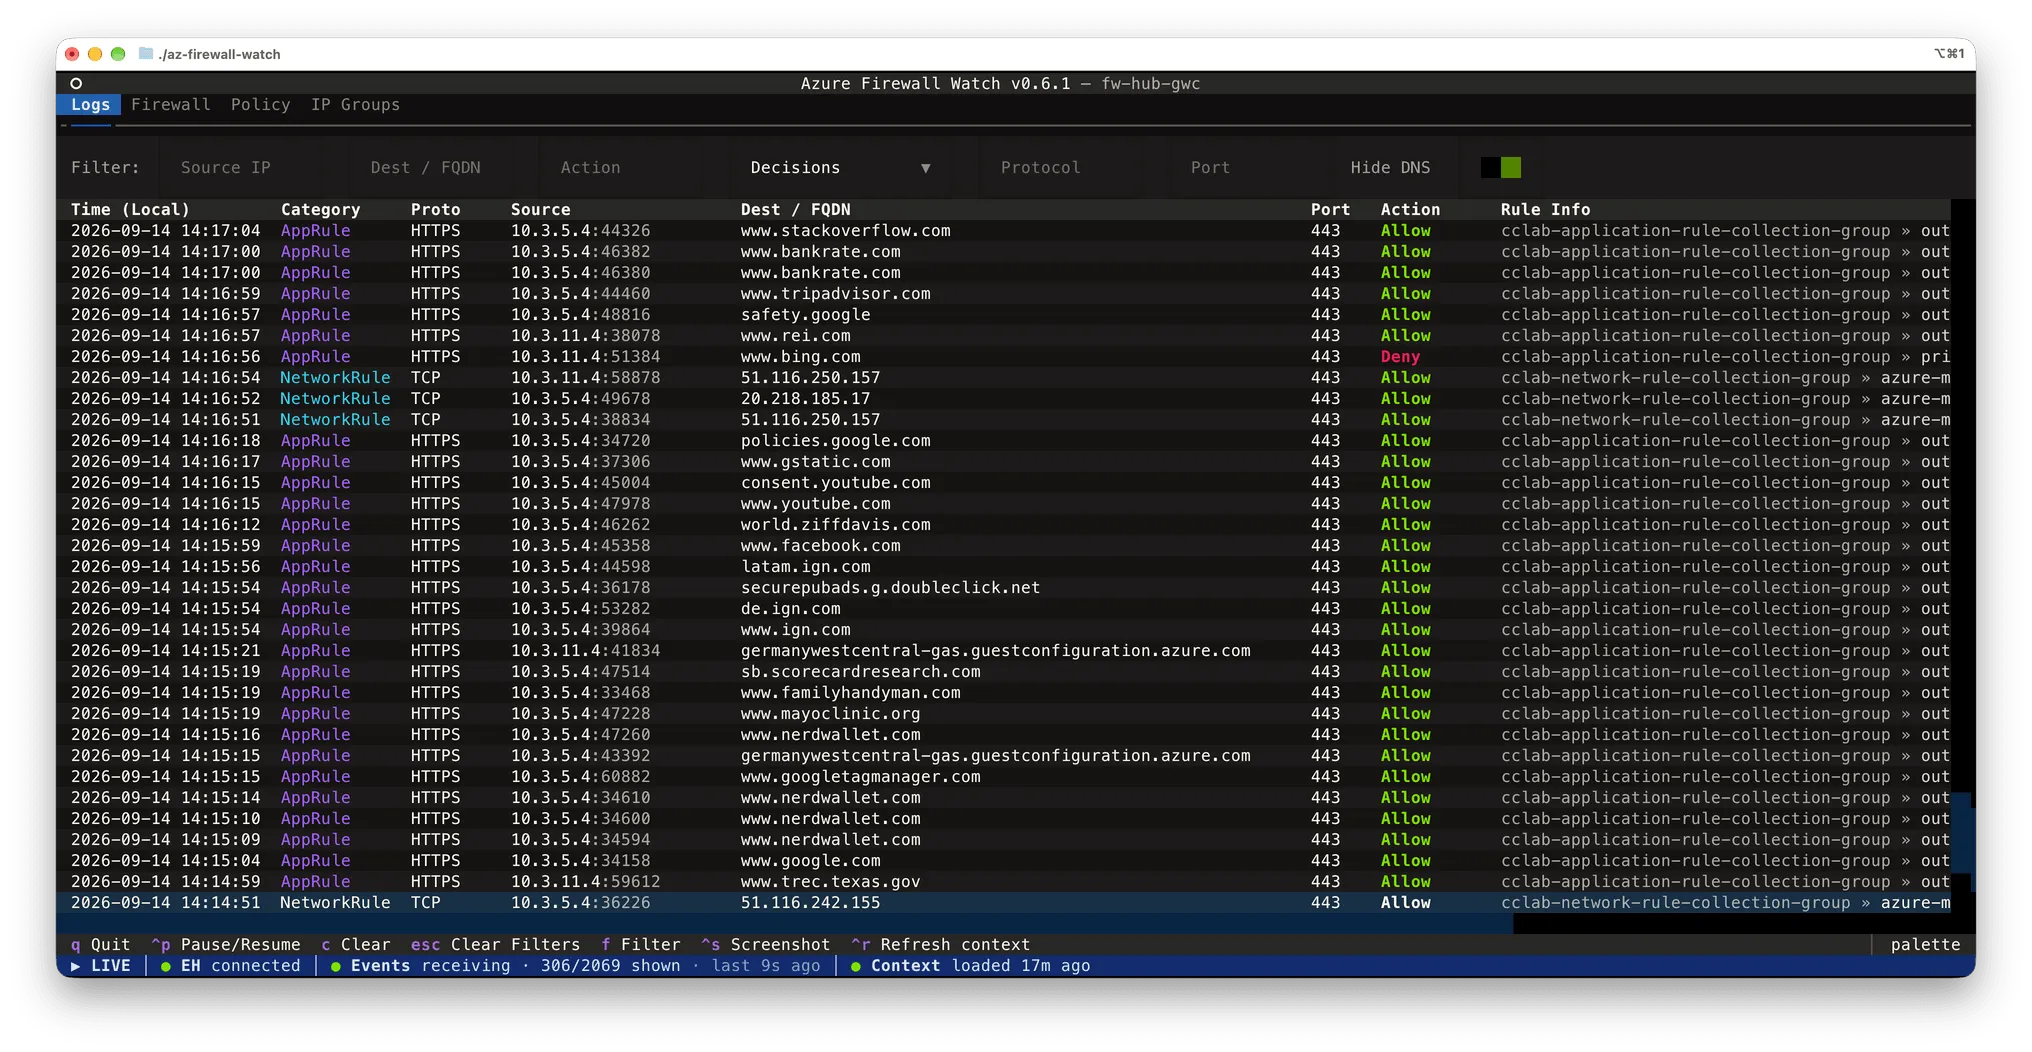
Rows show up as soon as Diagnostic Settings deliver them to the Event Hub, without Log Analytics ingestion in between. In customer environments as well as my lab, the observed latency from the firewall to the LAW table ranged from 2 to 10 minutes.
- Filters on source, destination or FQDN, action, category, protocol and port, applied as you type. Source and destination also take CIDR prefixes like
10.3.0.0/16, for IPv4 and IPv6 (currently onmain, part of the next release). - Presets in the category dropdown: Decisions (rules, Threat Intelligence, IDPS), Traffic (FlowTrace, FatFlow) and DNS. On a busy firewall with DNS proxy, the DNS queries drown everything else, so Hide DNS is on by default and switches itself off when you pick the DNS preset.
- Every category from
NetworkRuletoFatFlow, in the structured and the legacy log format. FlowTrace rows show the TCP flag (SYN-ACK,RST, …), FatFlow rows the rate, and the firewall’s own failed FQDN lookups get their ownDnsFailurecategory. - A status bar with three sources: Event Hub connection, events and policy context. The Events segment says when the last record arrived (
last 9s ago), so one glance tells me whether everything basically works the way I need it to.
The mouse works, too, but the keyboard is faster: f jumps into the filter bar, Esc clears all filters, Ctrl + P pauses the stream, c clears the table, Ctrl + S saves a screenshot of the current view, and Enter opens a row. After a connection drop the viewer keeps reconnecting on its own, so a long session survives a VPN switch or the hotel Wi-Fi (you know which one I mean).
Which rule was it, and why not the one above?
A log row tells you Allow and the rule path. What it does not tell you: which rules the flow passed on the way, why the deny collection above it did not fire, and what that IP group actually contains.
That is what the policy context adds. The viewer reads the firewall, its policy including the parent policy, and the referenced IP groups from Azure Resource Manager. It only reads, and Reader is enough. Press Enter on a row, and next to the row’s fields you get the evaluation trace. Here is an allowed HTTPS request to meta.wikimedia.org:
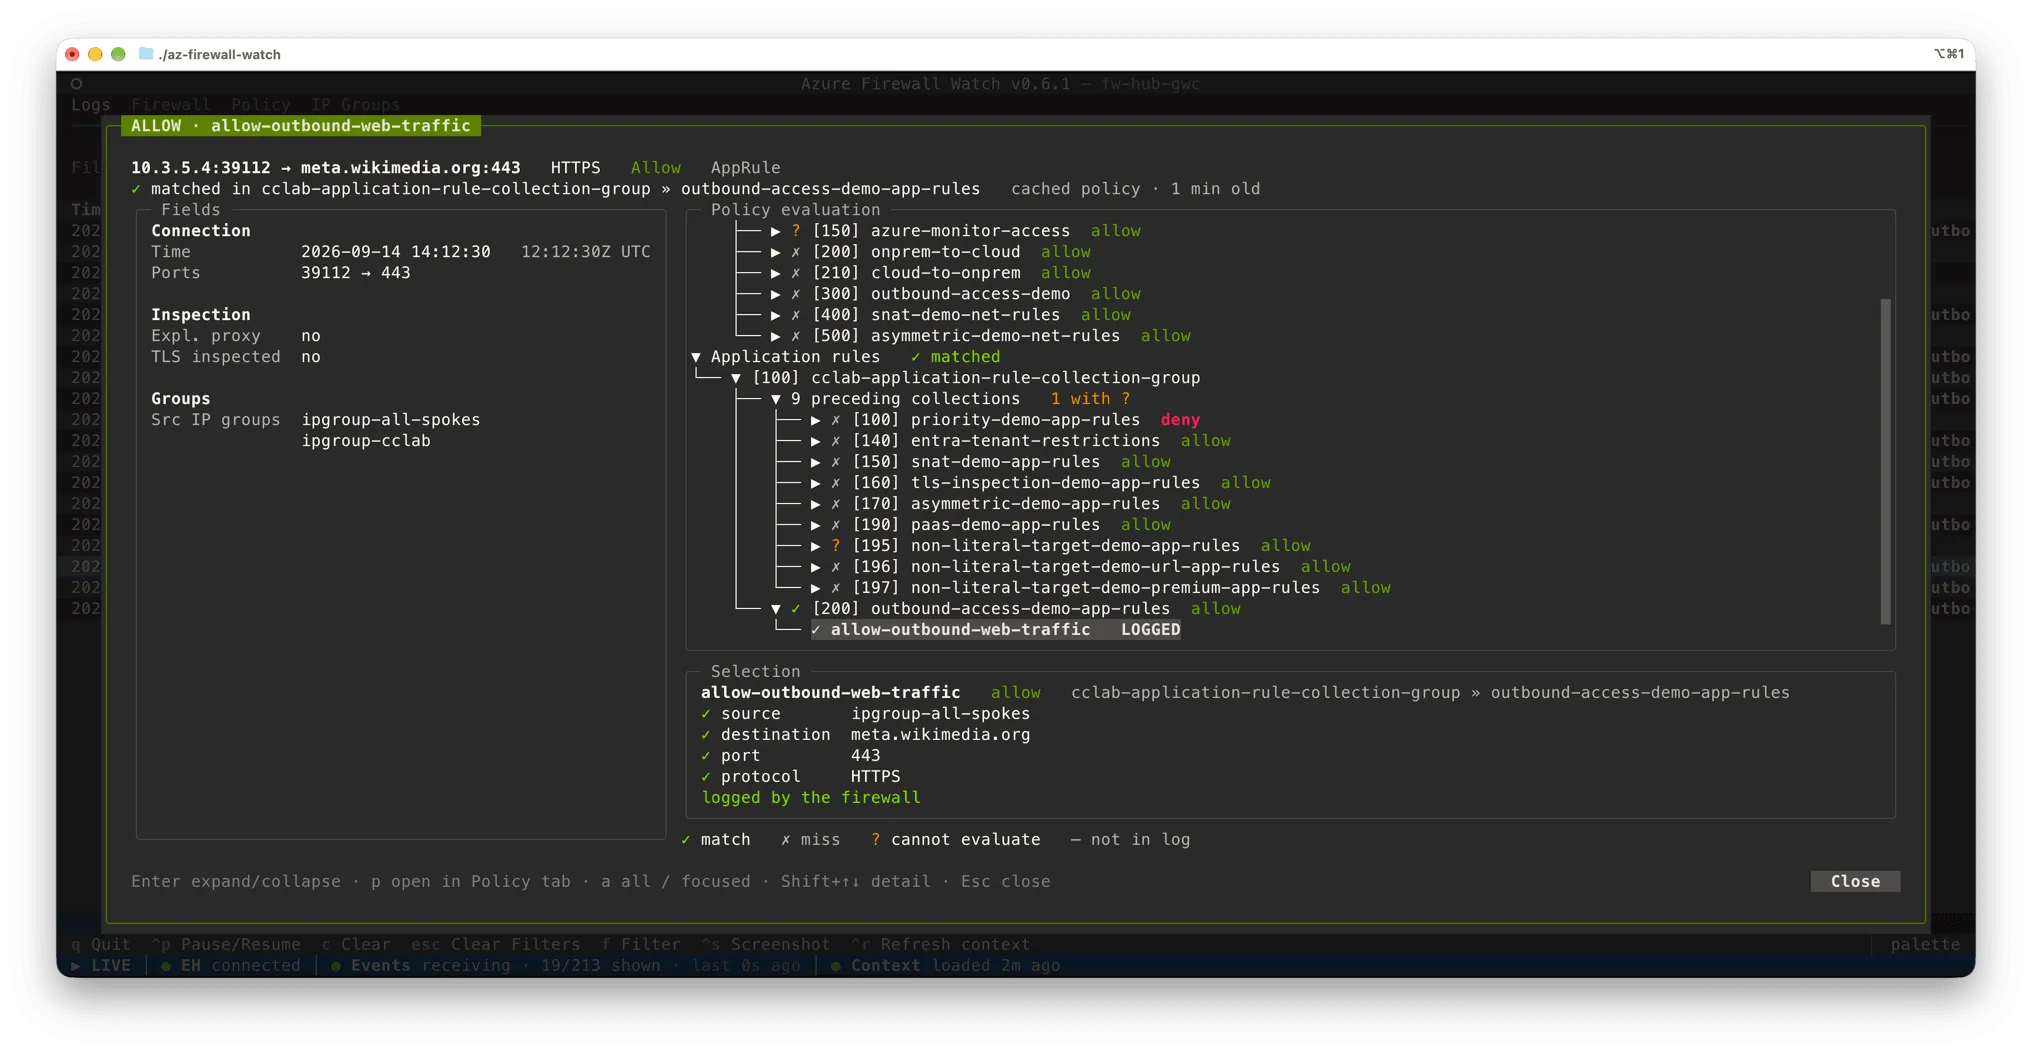
The trace follows the order Azure Firewall uses: Threat Intelligence first, then DNAT, network and application rules, the inherited policy before the child, each by priority. Collections the flow missed before the logged rule are folded into one line, and the panel under the tree shows each criterion of the selected rule with the logged value next to what the rule expects.
Where it really pays off is a Deny, no rule matched row. The trace then walks the whole policy and names the criterion that kept each near miss out, down to ✗ port 8443 not in 443. In a parent and child policy with a dozen collections, that is a lot faster than reading the policy yourself.
My rule for the trace: whatever cannot be decided locally is a ?, never a ✓. Service tags, FQDN tags, web categories and target URLs are not resolvable from a log row, and neither are destination addresses on an application rule. Azure Firewall matches those against its own DNS resolution of the Host header or the SNI, and that resolution is nowhere in the log. Version 0.5.1 was a whole release that only took back verdicts the trace had no grounds for. I’d rather see a question mark than a confident wrong answer.
Two things in the logs surprised me in the lab, both checked against real records:
- A TLS-inspected HTTPS request is logged as the decrypted inner request:
ProtocolisHTTP/1.1,IsTlsInspectedistrue. Compare that naively against an HTTPS rule and you get a miss on the very rule that terminates TLS. The trace reads such a row as HTTPS and says so. - A request through the explicit proxy is logged with the real destination port (
80,443), not the proxy port. So the port compares like on any other row.
The Firewall tab: why is that category empty?
The policy context also brings three tabs: Firewall, Policy and IP Groups. The one I open most is the Logging block on the Firewall tab. It shows the log categories against the targets of all diagnostic settings, and one Event Hub coverage line for the hub the viewer reads from: complete, or incomplete with the missing names.
It only counts what this firewall can produce: no IDPS log without Premium and IDPS switched on, no DNS log without the DNS proxy, no FatFlow log without the fat flow switch. That last one is off by default and the usual answer to “why do I never see FatFlow rows?”.
The rest of the tab covers questions that come up in troubleshooting sooner or later: how the firewall scales, whether a maintenance window is assigned (a burst of resets in the log during maintenance looks a lot like an incident), and whether a NAT gateway on the firewall subnet changes which public IP the far end sees. Where the viewer cannot know something, because it reads no route tables, it says that instead of guessing.
How it works
The viewer reads from two independent sources, and only the first one is required:
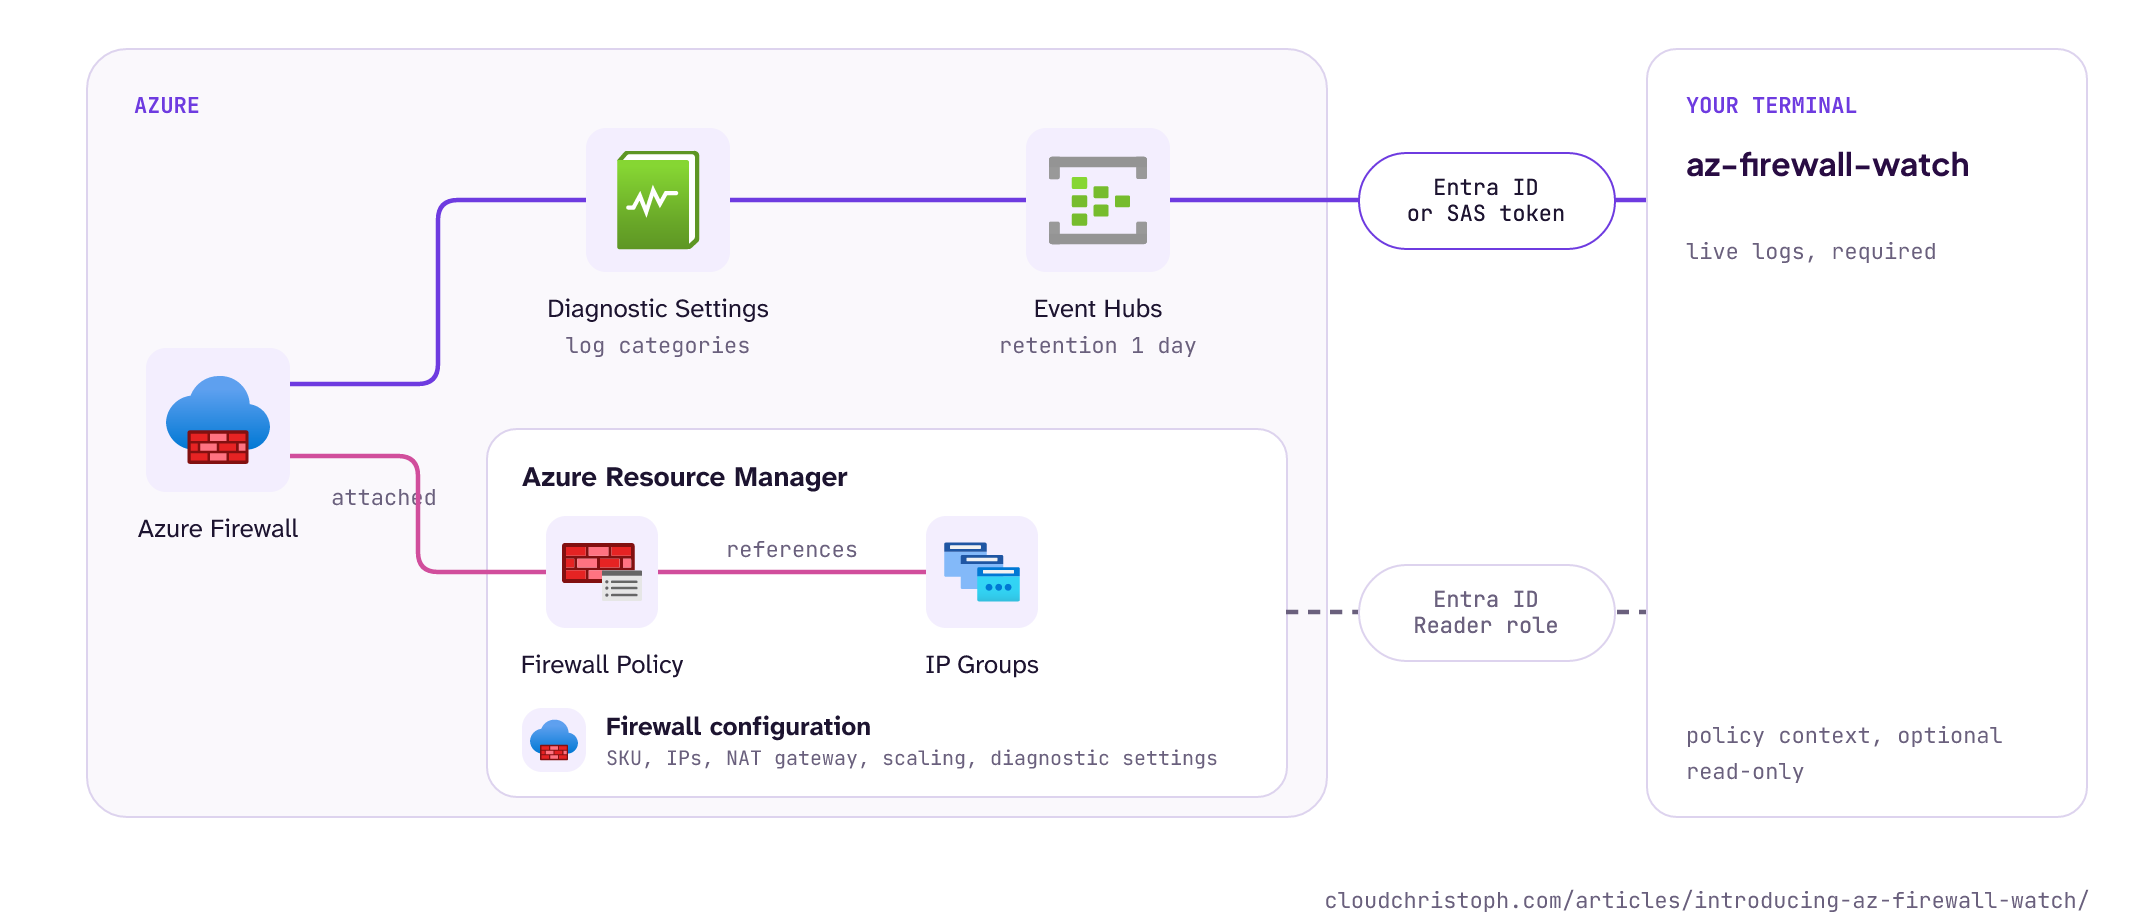
If the viewer must not touch anything besides the Event Hub, set POLICY_CONTEXT=off. Then there are no ARM requests, no Azure CLI token and no cache file, just the Logs tab. The setup wizard asks before it writes the configuration, so nobody gets policy reads by surprise.
Costs
An Event Hub in your environment is needed for the tool, but honestly, it’s quite affordable: a Basic namespace with one Throughput Unit costs $0.015 per hour, about $11 per month, Standard twice that. On top come $0.028 per million ingress events.*
* = based on retail prices as of October 2026 in the Azure Region Germany West Central; Your costs might be different. See Event Hubs pricing.
Basic is enough for the viewer, but check its limits first: one consumer group, one day of retention, and no Private Link or IP firewall. If your landing zone requires private endpoints for PaaS services, Basic is out and you need Standard. And treat FlowTrace and FatFlow as troubleshooting switches, not permanent settings: they change the event volume a lot.
Getting started
Download the binary from the latest release and start it. The setup wizard takes over from there, and the getting started guide has every step. The binaries are not signed (yet), so Windows SmartScreen will warn you, and on macOS you have to remove the quarantine flag first.
The wizard can discover an existing Event Hub, take names or a SAS connection string, or deploy a new Basic namespace and point the firewall’s Diagnostic Settings at it. The deploy path is my favorite, because it builds the whole pipeline in 2 to 3 minutes. Allow another 10 to 15 minutes until the first events arrive. One caveat: if your environment enforces naming, tags or private endpoints with Azure Policy (as it should), the deployment will likely fail. In that case build the hub with your IaC and connect it with Discover.
For authentication I recommend Entra ID: passwordless, nothing secret on disk. Thanks to @kyjones03 for contributing the Entra ID support! SAS works everywhere, but the connection string lands in .env, so treat that file like the secret it is.
What it doesn’t do (yet)
- One firewall per session. If several firewalls write into the same hub, the policy context comes from the first one the viewer sees. Please let me know if you actually have such a scenario.
- It explains the cached policy. The cache lives for an hour, because we want to be friendly citizens for the Azure Resource Manager API. 😉 A row naming a rule the cache does not know triggers a re-fetch, and
Ctrl+Rforces one. - No history. The viewer shows what arrives after it starts. With
EVENT_HUB_START_POSITION=earliestit replays what is still in the hub’s retention, for anything older there is still Log Analytics. - Classic rules directly on the firewall, outside a policy, are ignored. Please don’t use them anymore, migrate to Firewall Policy.
Conclusion
If you troubleshoot Azure Firewall more than once in a while (or just once, right now, while you and your on-prem firewall colleagues are furious about the log ingestion time 😉), a Basic Event Hub with a diagnostic setting is cheap insurance. My recommendation: keep one wired up permanently in your hub, so the live view is there when the next call starts, and switch on FlowTrace only for the session that needs it.
Next on my idea list: an MCP server, so an AI agent can query the live stream and ask the trace why a flow was denied. I know, you must think I’m nuts … but … why not?! 🤓 And publishing via package managers, starting with Homebrew, so installing and updating becomes a single command.
Hope it helps! If something annoys you (or works great), open an issue on GitHub. I would love a GitHub ⭐ from you. It means a lot to me.

Get the next one by mail
One mail per new article. No newsletter, no tracking, no spam.
You'll get a mail to confirm first. Unsubscribe with one click in any mail. Prefer a feed? RSS. Details in the privacy notice.
Comments